GUITutorial
Jimena GUI tutorial
The GUI allows you to comfortably study the behavior of networks for different interaction parameters (decays, weights etc.), simulation methods, perturbations and network states. It also features some basic analyses (e.g. stable state search for discrete and continuous models). All result can be exported as data tables.
The GUI can be started by double-clicking on the jimena.jar file.
The Main window
Menu bar: The functions available in the menu bar are described in detail in separate sections (see below).
Title bar: The title bar shows the file name of the network shown in the main window and its time index. The time index increases when the network is simulated.![]()
Jimenas toolbar
Toolbar:
Simulation Method: Determines the simulation method used not only by simulations shown in the GUI, but also by all analyses (e.g. stable state searches).
Simulated Time: The maximum time (in seconds) a simulation is conducted in the GUI (if it is not aborted) and also the maximum time a stable state in searched in several analysis algorithms.
dt: The step size used by the differential equation solver in all simulations and analyses.
Max Speed: The maximum speed of simulations in the GUI. This option is ignored in analyses which always run as fast as possible.
Single Step: The network currently shown the main window is simulated for 'dt' seconds in continuous models and one step in discrete models.
Simulate: The network currently shown the main window is simulated for 'Simulated Time' seconds with a step size of 'dt' and a maximum speed of "Max Speed".
Reset Simulation: Resets the values of all nodes and the time index of the network. Interaction parameters (decays, weights etc.) and perturbations remain unchanged.
Graph panel: Shows the network currently loaded in the GUI. Boolean nodes and the functions defined by them as well as inhibiting influences are not displayed and replaced by a single arrow even for complex interaction functions. A left click on a node opens the node in the Nodes Data Table (see below), a right click activates or deactivates the node in the Charts Window (see below).
The Network menu
Load Simulation: Opens a jimena-file which contains a complete network which was previously loaded in Jimena. This includes the network structure, the values of the nodes, the time index, the perturbations and the interaction parameters.
Import yED File: Imports a network defined by a yED file. For a short introduction on how to create those files read the library tutorial and study the examples.
Reload: Reloads the currently loaded file.
Save Simulation: Saves the currently loaded network as a jimena-file. This includes the network structure, the values of the nodes, the time index, the perturbations and the interaction parameters.
[Recently opened files]
Exit: Closes the whole application.
The View menu
The nodes data table
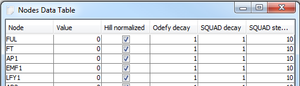
Nodes Table: A table which displays information about the nodes. All values except for the node names can be changed.
Node: Name of the node.
Value: Current value of the node.
Hill normalized: Whether the value of the HillCube interpolation is normalized (cf. Odefy) if the simulation method is Normalized HillCube. Otherwise this value has no effect.
Odefy decay: Odefy's τ parameter.
SQUAD decay: SQUAD's γ parameter.
SQUAD steepness: SQUAD's h parameter.
The inputs data table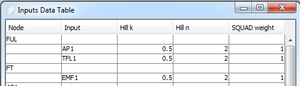
Inputs Table: A table which displays information about the interactions between the nodes. The interaction parameters can be changed.
Node: Name of the node.
Input: The node which is an input to the function which defines the behavior of the given node.
Hill k: The HillCube's k parameter.
Hill n: The HillCube's n parameter.
SQUAD weight: SQUAD's α or β parameter.
The perturbations window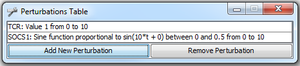
Perturbations Table: A table which lists all perturbations of the networks. New perturbations can be created, existing ones can be configured and removed.
[The list of perturbations]: The perturbations and their configuration. Double-click to change a perturbation.
Add New Perturbation: Adds a new perturbation.
Remove Perturbation: Removes the perturbation selected in the list.
The perturbations window
Charts Window/Data Export: A window which displays time series data from simulations done in the main window. Select a node in the list on the right side of the window to display its graph. Multiple nodes can be selected by pressing the control key. Nodes can also be selected and unselected by right-clicking on the node in the main window. A simulation has to have been run in the main window for the charts window to show any data.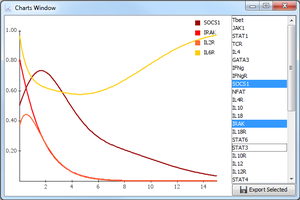
Export Selected: Exports the data from the selected nodes to a comma separated text file. The time resolution of the exported data can be set in the settings window ('minimum time between log entries')
Settings window: Settings for simulations and analyses.
Maximum difference between duplicates: This setting applies to searches for stable states. If the values of all nodes differ by less than this value, two stable state found by the algorithm are considered identical.
Maximum deviation for a curve to be considered stable (a) und Minimum time within the maximum deviation (b): When a stable state is determined by simulating from an initial state, the network is considered stable if the values of all nodes do not change by more than (a) for (b) seconds.
Minimum (simulation) time between two log entries during the simulation: This setting determines how often the current network state is written to the log during a simulation in the main window. The log is displayed in the charts window and can be exported there.
Maximum number of threads used in multithreaded calculations: Should be the number of your logical processor cores or slightly less.
Show All Windows: Opens all aforementioned windows.
The Analysis menu
Random Values: Assigns all nodes in the main windows random values between 0 and 1.
Find Stable State From Current State: Simulates the network in the main window until a stable state is reached. The SSS is displayed, but the network in the main window is not changed. The maximum simulation time the stable state is searched for is determined by the 'Simulated Time' setting in the main window.
The result of a SSS search
Find Stable States: Searches for stable states of the network by simulating it starting from random network states. The maximum time the network is simulated until a stable state is reached, the simulation method and the step size of the ODE solver is determined by the 'Simulated Time', 'Simulation method' and 'dt' settings in the main window. The SSSs can be exported for example by pressing [Ctrl]+[A] to select the whole table and copying the selection ([Ctrl]+[C]).
Discrete Stable States: Determines all stable states of the network assuming a discrete model (independent of the updating scheme) using binary decision diagrams. The SSS can again be copied easily (see above).