JimenaE
Jimena Expert
Jimena Expert (JimenaE) is a Java genomic regulatory network simulation framework which focuses on computational efficacy and a modularized architecture to facilitate the development and testing of new algorithms and models surrounding GRNs. The software package including new-added MATLAB routines enabled comprehensive analysis based for the constructed network, including steady state computation, regulation simulation and data-driven algorithms.
One of the most important application of Jimena square is the detection of new drug targets, even in complex regulatory networks, by rational and systematical methods. A further potential of Jimena square is to test different drug targets, expected to cause a desired outcome of a corresponding experiment, in preliminary investigations in silico to figure out the most promising drug target(s) for the desired outcome before setting up an experiment in vivo or in vitro which supports the planning of experiments and studies. Therefore Jimena square accelerates the discovery of new drugs.
- Network import from yED graph files (Example 1: Download (source), Example 2: Download)
- Full support of the exponential interpolation model implemented in SQUAD
- Full support of the polynomial interpolation models implemented in Odefy, including a significantly better implementation of the interpolation algorithm
- Several discrete update schemes
- Perturbation support in all models
- Several algorithms for the search of steady stable states in all models (fully multithreaded)
- New developed data-driven routine enabling an investigation on external stimuli to switch between steady states in regulatory networks
It is developed by Chunguang Liang, Tim Breitenbach and Stefan Karl at the Department of Bioinformatics of the University of Würzburg and supervised by Thomas Dandekar (head of the department).
Network input format
Activating influences are modeled using the yED standard arrow tip, inhibiting influences using any other tip (e.g. a diamond). Boolean nodes are modeled using nodes with the captions AND, OR, NOT, &&, ||, !. Cf. the examples above.
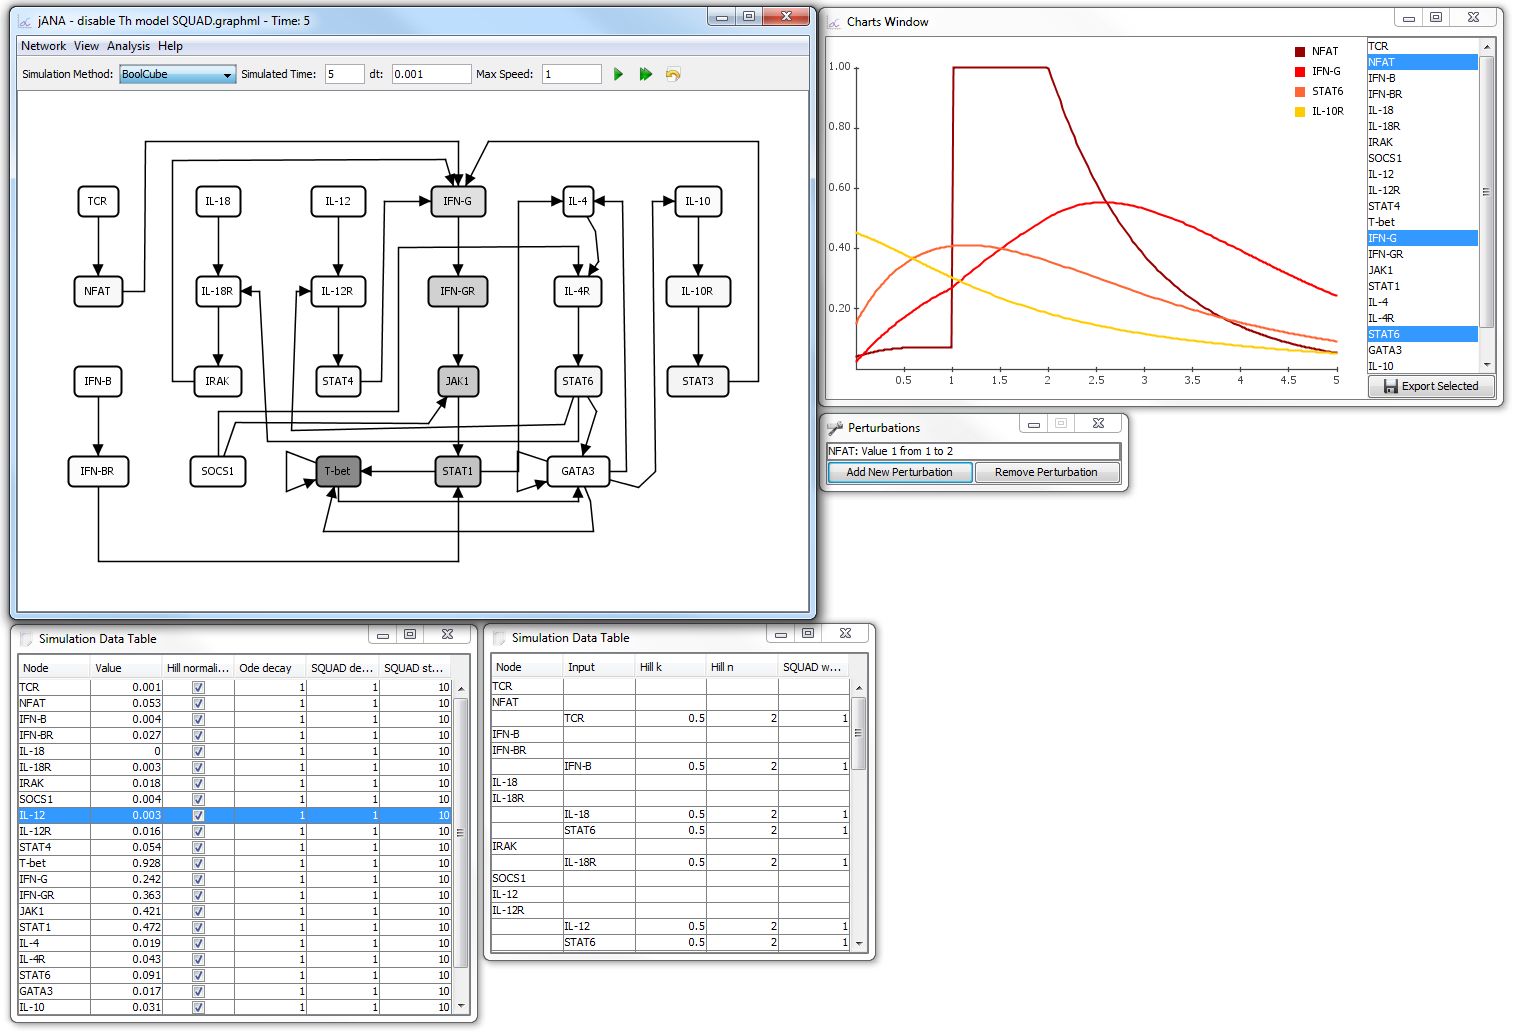
Screenshot
The screenshow shows a simulation of the T-helper network in the jIMENA GUI (which is not yet included in the release). The simulation was started from random values and the NFAT node was set to 1 between the time indices 1 and 2 by a perturbation.
Download
Jimena square is publicly available here. To run Jimena square, a Java runtime library (JRE) 8 or above is necessary. In addition, a Mathworks Matlab environment is required to run the involved Matlab routines. Jimena square is released under the GNU Lesser General Public License Version 3. The source code is also available at here.
Network can be edited with yEd software (URL:https://www.yworks.com/products/yed/download).
YEd converter
A Perl-script is available to translate .txt files into yED graphml format.
Download
Tutorial
Step 1. Start Jimena square
Unpack the downloaded Jimena square zip file, users could click "jimena.jar" (windows) or in a console "java -jar jimena.jar (linux)" to run it.
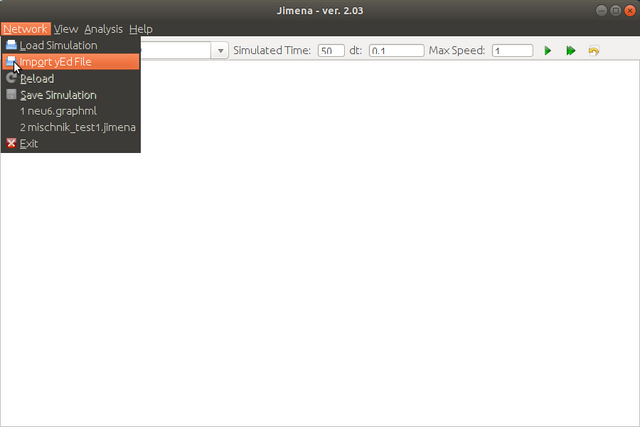
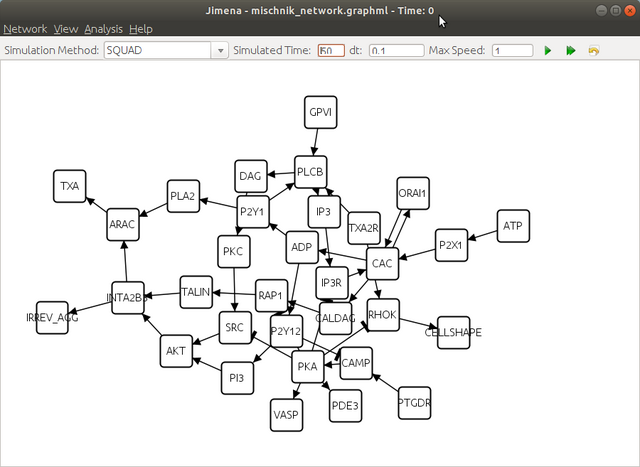
Step 2. Load the network created with jED.
The step size can be specified in the dt input box (see the figure below), we suggest to use 0.1 for most case which is exactly the default value. However, please adjust it according to your network model and simulation purpose (usually 0.001 - 10 ). In the step 6, the step size value will appear again as "Interval", the number will be same to the "dt" here. You could adjust it again for the generated matlab routine.
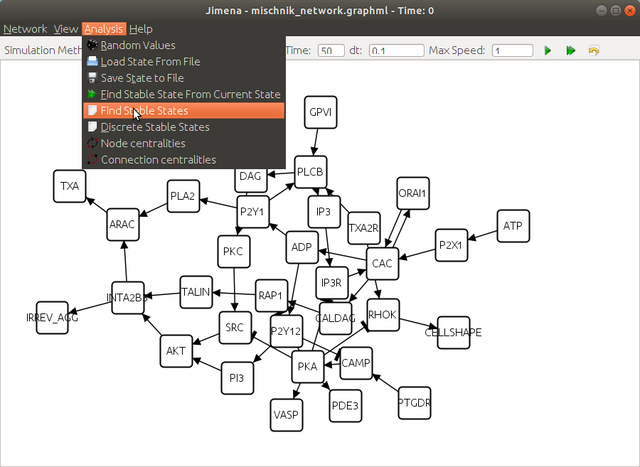
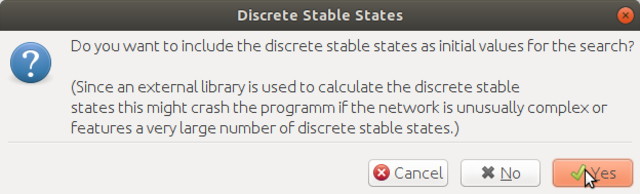
Step 3. Compute the steady states
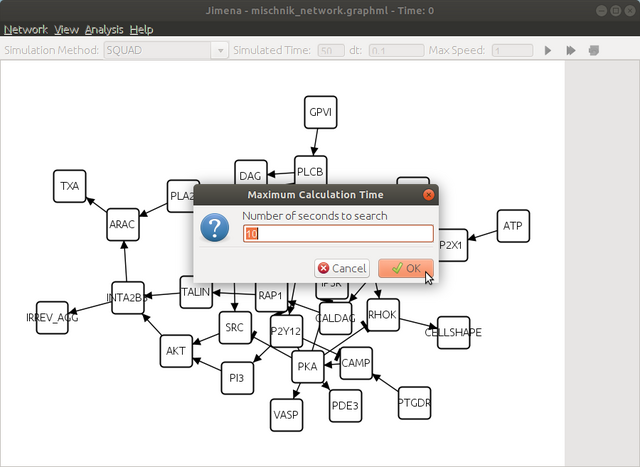
here click yes to continue
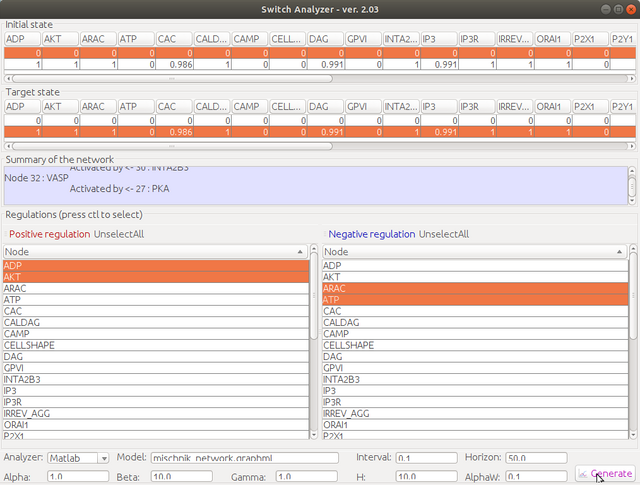
Step 4. Select the desired steady states, then click Switch Analyzer
![]()
Step 5. Select the initial state and the target state, and then choose positive regulation nodes in the left selection list and negative regulation nodes in the right selection list (multiple selection is allowed with ctl key). Change the parameter according to your requirement, then click "generate"
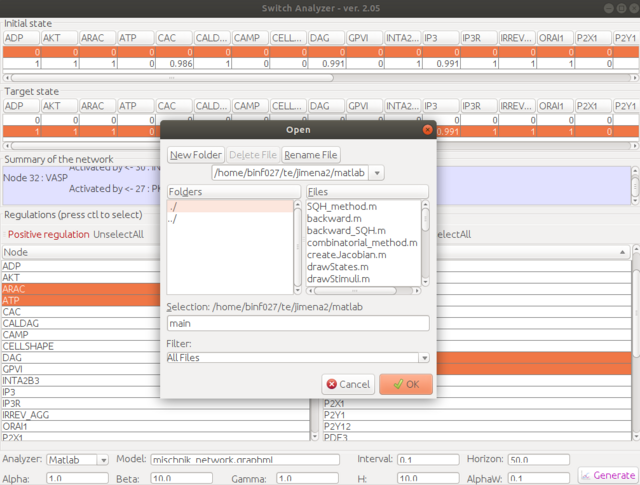
Step 6. Choose the location of the Matlab script folder. Give a script name, e.g., "main". You could also use the other name, but for first-time trial, "main" is highly recommended. The generated script will be named as "main.m".
Step 7. Run Matlab in the script folder where you extracted the package, e.g., /home/username/jimena2/matlab
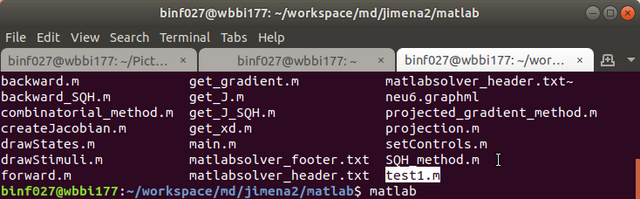
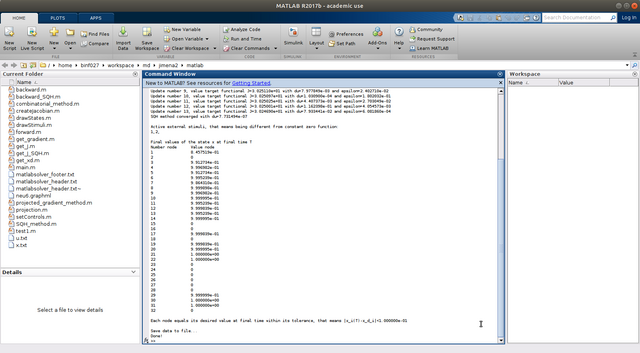
Step 8. Run the script, e.g., type "main" in the Matlab console (for most case), however, if you name it as other name, e.g., "test1" in the previous step, you have to type the corresponding file name here.
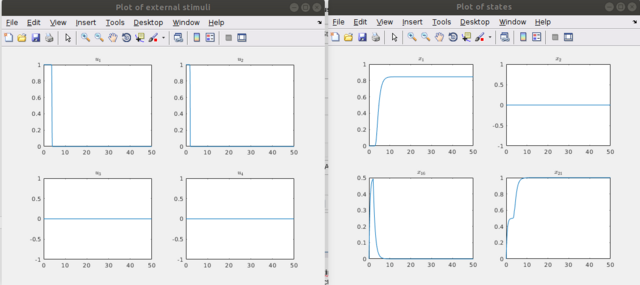
Wait until it finishes, it will generate two result files, "x.txt" collect all the node states, and "u.txt" contains all the regulations.
Step 9 One can examine the controls with "drawStimuli(1,'u.txt',1)" or "drawStimuli([1,2,3,4],'u.txt',2)" in a multiple column view, whereas one can also plot several nodes/external stimuli by entering a vector of the indices of the nodes/external stimuli as follows "drawStates([1,2,16,21],'x.txt',2)", where 2 is the number of columns in the window in which the time curves are plotted. Here one could notice the activation level in the first plot, the constant level in the second, the activation level drops as the stimulus is stopped (see the stimuli figure) in the third (node 16), the last figure represents the relaxing of the node 21 into its desired state after sufficient application of the stimuli, in this case it is a pure activation.