Computing
Software
Please look at the extensive tutorial.
YANAvergence
![]()
Latest YANA software version, please cite: Liang C, Liebeke M, Schwarz R, Zühlke D, Fuchs S, Menschner L, Engelmann S, Wolz C, Jaglitz S, Bernhardt J, Hecker M, Lalk M, Dandekar T. Staphylococcus aureus physiological growth limitations: insights from flux calculations built on proteomics and external metabolite data. Proteomics. 2011 May;11(10):1915-35.

Comparing proteomics and metabolomics allows insights into Staphylococcus aureus physiological growth. We update genome and proteome information and deliver strain-specific metabolic models for three S. aureus strains (COL, N315, and Newman). We find a number of differences in metabolism and enzymes. Growth experiments (glucose or combined with oxygen limitation) were conducted to measure external metabolites. Fluxes of the central metabolism were calculated from these data with low error. In exponential phase, glycolysis is active and amino acids are used for growth. In later phases, dehydroquinate synthetase is suppressed and acetate metabolism starts. There are strain-specific differences for these phases. A time series of 2-D gel protein expression data on COL strain delivered a second data set (glucose limitation) on which fluxes were calculated. The comparison with the metabolite-predicted fluxes shows, in general, good correlation. Outliers point to different regulated enzymes for S. aureus COL under these limitations. In exponential growth, there is lower activity for some enzymes in upper glycolysis and pentose phosphate pathway and stronger activity for some in lower glycolysis. In transition phase, aspartate kinase is expressed to meet amino acid requirements and in later phases there is high expression of glyceraldehyde-3-phosphate dehydrogenase and lysine synthetase. Central metabolite fluxes and protein expression of their enzymes correlate in S. aureus.
Download
YANAvergence is an important extension to YANAsquare software, which allows integrating more experimental data to inspect the adaptation of metabolic network under different stresses, conditions.
YANAsquare GUI software package - Download
Requirement: under windows/Linux/Mac system with MASS libraries installed.
Tutorial and supplementary files for flux computation:
1. List of processes in the strain-specific models and comparison: suppl_1_processes.xls
2. Tutorial on the use of the program YANAvergence: yanavergence_demo.rar
3. Proteome data set: suppl_2_proteins.pdf
4. Condensed Model in SBML format: suppl_0_sac_model.sbml
Former versions
-YANAsquare Software: Download
-YANA Software: Download
-Metatool: Download
BMC Bioinformatics. 2005 Jun 1;6:135. YANA - a software tool for analyzing flux modes, gene-expression and enzyme activities. Schwarz R, Musch P, von Kamp A, Engels B, Schirmer H, Schuster S, Dandekar T. Dept of Bioinformatics, Biocenter, University of Würzburg, Germany.
BACKGROUND: A number of algorithms for steady state analysis of metabolic networks have been developed over the years. Of these, Elementary Mode Analysis (EMA) has proven especially useful. Despite its low user-friendliness, METATOOL as a reliable high-performance implementation of the algorithm has been the instrument of choice up to now. As reported here, the analysis of metabolic networks has been improved by an editor and analyzer of metabolic flux modes. Analysis routines for expression levels and the most central, well connected metabolites and their metabolic connections are of particular interest. RESULTS: YANA features a platform-independent, dedicated toolbox for metabolic networks with a graphical user interface to calculate (integrating METATOOL), edit (including support for the SBML format), visualize, centralize, and compare elementary flux modes. Further, YANA calculates expected flux distributions for a given Elementary Mode (EM) activity pattern and vice versa. Moreover, a dissection algorithm, a centralization algorithm, and an average diameter routine can be used to simplify and analyze complex networks. Proteomics or gene expression data give a rough indication of some individual enzyme activities, whereas the complete flux distribution in the network is often not known. As such data are noisy, YANA features a fast evolutionary algorithm (EA) for the prediction of EM activities with minimum error, including alerts for inconsistent experimental data. We offer the possibility to include further known constraints (e.g. growth constraints) in the EA calculation process. The redox metabolism around glutathione reductase serves as an illustration example. CONCLUSION: A graphical toolbox and an editor for METATOOL as well as a series of additional routines for metabolic network analyses constitute a new user-friendly software for such efforts.
Neural Activity Cubic
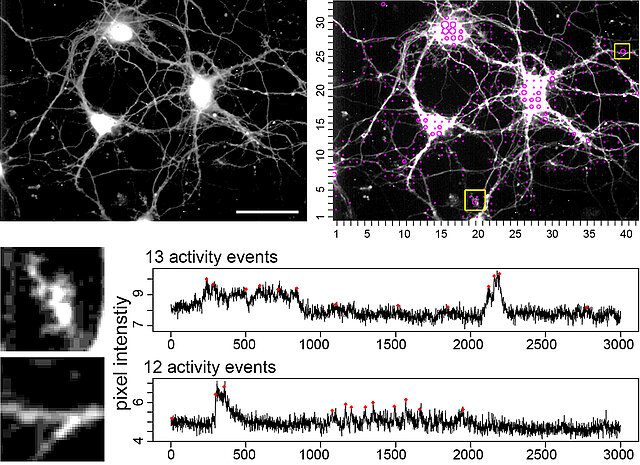
NA³ - Computation of local and 'signal-close-to-noise' calcium activity
Calcium imaging has become a standard tool to investigate local, spontaneous, or cell-autonomous calcium signals in neurons. Some of these calcium signals are fast and ‘small’, thus making it difficult to identify real signaling events due to an unavoidable signal noise. Therefore, it is difficult to assess the spatiotemporal activity footprint of individual neurons or a neuronal network. We developed this open source tool to automatically extract, count, and localize calcium signals from the whole x,y-t image series. The tool is useful for an unbiased comparison of activity states of neurons, helps to assess local calcium transients, and even visualizes local homeostatic calcium activity. The calcium event computation is based on a continuous wavelet transform-guided peak detection to identify calcium signal candidates. The highly sensitive calcium event definition is based on identification of peaks in 1D data through analysis of a 2D wavelet transform surface. The tool is powerful enough to visualize signal-close-to-noise calcium activity, but can also be applied on other imaging data.
Availability of the software, test data, raw data
The application NA3 (NA cubic) is an open source software tool and is available at:
https://github.com/jpits30/NeuronActivityTool.
The tool containing an additional ROI feature is available at:
https://github.com/jpits30/NeuronActivityTool_ROI.
A detailed user manual can be found on the corresponding GitHub pages.
Software updates and further information will be released at GitHub.
Test data and raw data and further information can be found at: https://www.biozentrum.uni-wuerzburg.de/bioinfo/computing/neuralactivitycubic/.
The raw data can be used as standardization data to compute global and local calcium activity, signal-close-to-noise activity, signal components, or can be used to create signal templates for local activity events.
3D ART VeSElecT
3D Automated Reconstruction Tool for Vesicle Structures of Electron Tomograms
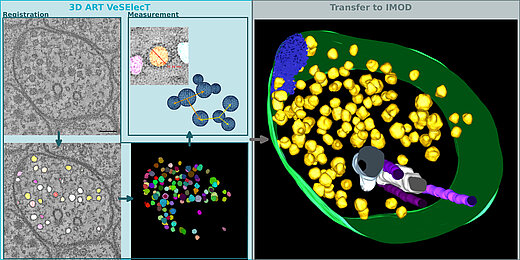
Automatic image reconstruction is critical to cope with steadily increasing data from advanced microscopy. We describe here the Fiji macro 3D ART VeSElecT which we developed to study synaptic vesicles in electron tomograms. We apply this tool to quantify vesicle properties (i) in embryonic Danio rerio 4 and 8 days past fertilization (dpf) and (ii) to compare Caenorhabditis elegans N2 neuromuscular junctions (NMJ) wild-type and its septin mutant (unc-59(e261)). We demonstrate development-specific and mutant-specific changes in synaptic vesicle pools in both models. We confirm the functionality of our macro by applying our 3D ART VeSElecT on zebrafish NMJ showing smaller vesicles in 8 dpf embryos then 4 dpf, which was validated by manual reconstruction of the vesicle pool. Furthermore, we analyze the impact of C. elegans septin mutant unc-59(e261) on vesicle pool formation and vesicle size. Automated vesicle registration and characterization was implemented in Fiji as two macros (registration and measurement). This flexible arrangement allows in particular reducing false positives by an optional manual revision step. Preprocessing and contrast enhancement work on image-stacks of 1nm/pixel in x and y direction. Semi-automated cell selection was integrated. 3D ART VeSElecT removes interfering components, detects vesicles by 3D segmentation and calculates vesicle volume and diameter (spherical approximation, inner/outer diameter). Results are collected in color using the RoiManager plugin including the possibility of manual removal of non-matching confounder vesicles. Detailed evaluation considered performance (detected vesicles) and specificity (true vesicles) as well as precision and recall. We furthermore show gain in segmentation and morphological filtering compared to learning based methods and a large time gain compared to manual segmentation. 3D ART VeSElecT shows small error rates and its speed gain can be up to 68 times faster in comparison to manual annotation. Both automatic and semi-automatic modes are explained including a tutorial.
Detailed description and download, please see here
Classification Macro
Synaptic vesicles (SVs) are a key component of neuronal signaling and fulfil different roles depending on their composition. In electron micrograms of neurites, two types of vesicles can be distinguished by morphological criteria, the classical “clear core” vesicles (CCV) and the typically larger “dense core” vesicles (DCV), with differences in electron density due to their diverse cargos. Compared to CCVs, the precise function of DCVs is less defined. DCVs are known to store neuropeptides, which function as neuronal messengers and modulators. In C. elegans, they play a role in locomotion, dauer formation, egg-laying, and mechano- and chemosensation. Another type of DCVs, also referred to as granulated vesicles, are known to transport Bassoon, Piccolo and further constituents of the presynaptic density in the center of the active zone (AZ), and therefore are important for synaptogenesis.
To better understand the role of different types of SVs, we present here a new automated approach to classify vesicles and to quantify their properties from electron tomograms. We combine machine learning with an extension of our previously developed vesicle segmentation workflow, the ImageJ macro 3D ART VeSElecT, to reliably distinguish CCVs and DCVs using image-based features. We apply this method to electron tomograms of the C. elegans NMJs, and find an increased fraction of DCVs as well as a higher mean distance between DCVs and AZs in dauer larvae when compared to adult hermaphrodites. Our machine learning approach could be applied to study properties of different synaptic vesicle pools in electron tomograms of diverse model organisms.
Download software and test data:
updated version of 3D ART VeSElecT
test data
User descriptions:
How to use the Classification Macro
How to use the Python Script for retraining of the algorithm

J Chem Inf Comput Sci. 2002 Mar-Apr;42(2):405-7.
A versatile structural domain analysis server using profile weight matrices.
Schmidt S, Bork P, Dandekar T.
EMBL, Postfach 102209, D-69012 Heidelberg, Germany.
The WEB tool "AnDom" assigns to a given protein sequence all experimentally determined structural domains contained within it, including multidomain and large proteins. The server uses profile specific matrices from custom generated multiple sequence alignments of all known SCOP domains (SCOP version 1.75, updated). Prediction time is short allowing numerous applications for structural genomics including investigation of complex eukaryotic protein families.
PMID: 11911710 [PubMed - indexed for MEDLINE]

http://www.ncbi.nlm.nih.gov/pmc/articles/PMC441490/
Nucleic Acids Res. 2004 Jul 1;32(Web Server issue):W154-9.
Riboswitch finder--a tool for identification of riboswitch RNAs.
Bengert P, Dandekar T.
Biochemiezentrum, Project Group B2 (Dandekar/Schirmer), University of Heidelberg, Im Neuenheimer Feld 504, 69120 Heidelberg, Germany.
We describe a dedicated RNA motif search program and web server to identify RNA riboswitches. The Riboswitch finder analyses a given sequence using the web interface, checks specific sequence elements and secondary structure, calculates and displays the energy folding of the RNA structure and runs a number of tests including this information to determine whether high-sensitivity riboswitch motifs (or variants) according to the Bacillus subtilis type are present in the given RNA sequence. Batch-mode determination (all sequences input at once and separated by FASTA format) is also possible.
The program has been implemented and is available both as local software for in-house installation and as a web server at http://riboswitch.bioapps.biozentrum.uni-wuerzburg.de.
PMCID: PMC441490
PMID: 15215370 [PubMed - indexed for MEDLINE]
![]()
![]()
![]()
http://nar.oxfordjournals.org/content/31/13/3441.long
Nucleic Acids Res. 2003 Jul 1;31(13):3441-5.
A software tool-box for analysis of regulatory RNA elements.
Bengert P, Dandekar T.
Parasitology, University of Heidelberg, Im Neuenheimer Feld 324, 69120
Heidelberg, Germany.
We describe an integrated tool-box to identify regulatory RNA elements. The RNA analyzer collects general and specific information on any submitted RNA sequence or batch of sequences in FASTA format. It determines and rapidly scans the different regions of an RNA (including 5' UTR, CDS, 3' UTR in mRNA) and screens for specific RNA signals (in each of these regions, e.g. polyA-site, AU rich region etc. in 3' UTR). It runs a fast folding RNA routine to provide an overview of the RNA fold. Furthermore it analyzes structure content, fold energy and stem
loops. In addition, consensus templates are used to determine whether there are any functional structures present for translational control (template: IRE), structured RNA (template: tRNA consensus) or catalytic RNA (template: trans-splicing RNA), giving indications as to how well the structures found match to these templates.
PMCID: PMC168974
PMID: 12824342 [PubMed - indexed for MEDLINE]

![]()
http://www.biomedcentral.com/1471-2105/7/461
BMC Bioinformatics. 2006 Oct 20;7:461.
inGeno--an integrated genome and ortholog viewer for improved genome to genome comparisons.
Liang C, Dandekar T.
Department of Bioinformatics, Biocenter, University of Würzburg, Am Hubland, D-97074 Würzburg, Germany. liang@biozentrum.uni-wuerzburg.de
BACKGROUND: Systematic genome comparisons are an important tool to reveal gene functions, pathogenic features, metabolic pathways and genome evolution in the era of post-genomics. Furthermore, such comparisons provide important clues for vaccines and drug development. Existing genome comparison software often lacks accurate information on orthologs, the function of similar genes identified and genome-wide reports and lists on specific functions. All these features and further analyses are provided here in the context of a modular software tool "inGeno" written in Java with Biojava subroutines.
RESULTS: InGeno provides a user-friendly interactive visualization platform for sequence comparisons (comprehensive reciprocal protein--protein comparisons) between complete genome sequences and all associated annotations and features. The comparison data can be acquired from several different sequence analysis programs in flexible formats. Automatic dot-plot analysis includes output reduction, filtering, ortholog testing and linear regression, followed by smart clustering (local collinear blocks; LCBs) to reveal similar genome regions. Further, the system provides genome alignment and visualization editor, collinear relationships and strain-specific islands. Specific annotations and functions are parsed, recognized, clustered, logically concatenated and visualized and summarized in reports.
CONCLUSION: As shown in this study, inGeno can be applied to study and compare in particular prokaryotic genomes against each other (gram positive and negative as well as close and more distantly related species) and has been proven to be sensitive and accurate. This modular software is user-friendly and easily accommodates new routines to meet specific user-defined requirements.
PMCID: PMC1635569
PMID: 17054788 [PubMed - indexed for MEDLINE]
http://www.ncbi.nlm.nih.gov/pubmed/?term=dandekar-T+ingeno
![]()
Motivation: Profile Neighbor Joining (PNJ) as implemented in ProfDist is computationally efficient in reconstructing very large trees. Besides the huge amount of sequence data the structure is important in RNA alignment analysis and phylogenetic reconstruction.
Results: For this ProfDistS provides a phylogenetic framework that uses individual RNA secondary structures in reconstructing phylogenies based on sequence-structure alignments - using Profile Neighbor Joining (PNJ) with manual or iterative and automatic profile definition. Moreover, ProfDistS can deal also with protein sequences.
Availability: ProfDistS is freely available for non-commercial use for Windows, Linux and MAC operating systems at http://profdist.bioapps.biozentrum.uni-wuerzburg.de.
Contact: Tobias Müller, Matthias Wolf.
![]()
L1Base
http://nar.oxfordjournals.org/content/33/suppl_1/D498.long
Nucleic Acids Res. 2005 Jan 1;33(Database issue):D498-500.
L1Base: from functional annotation to prediction of active LINE-1 elements.
Penzkofer T, Dandekar T, Zemojtel T.
Department of Computational Molecular Biology, Max-Planck-Institute for Molecular Genetics, Ihnestrasse 73, D-14195 Berlin, Germany.
L1Base is a dedicated database containing putatively active LINE-1 (L1) insertions residing in human and rodent genomes that are as follows: (i) intact in the two open reading frames (ORFs), full-length L1s (FLI-L1s) and (ii) intact ORF2 but disrupted ORF1 (ORF2-L1s). In addition, due to their regulatory potential, the full-length (>6000 bp) non-intact L1s (FLnI-L1s) were also
included in the database. Application of a novel annotation methodology, L1Xplorer, allowed in-depth annotation of functional sequence features important for L1 activity, such as transcription factor binding sites and amino acid residues.
The L1Base is available online at http://l1base.molgen.mpg.de. In addition, the data stored in the database can be accessed from the Ensembl web browser via a DAS service (http://l1das.molgen.mpg.de:8080/das).
PMCID: PMC539998
PMID: 15608246 [PubMed - indexed for MEDLINE]
![]()
In Silico Biol. 2005;5(3):291-4. Epub 2005 Mar 16.
CBCAnalyzer: inferring phylogenies based on compensatory base changes in RNA secondary structures.
Wolf M, Friedrich J, Dandekar T, Müller T.
Department of Bioinformatics, Biocenter, University of Würzburg, Am Hubland,
D-97074 Würzburg, Germany.
The CBCAnalyzer (CBC=compensatory base change) is a custom written software toolbox consisting of three parts, CTTransform, CBCDetect, and CBCTree. CTTransform reads several ct-file formats, and generates a so called "bracket-dot-bracket" format that typically is used as input for other tools such as RNAforester, RNAmovie or MARNA. The latter one creates a multiple alignment based on primary sequences and secondary structures that now can be used as input for CBCDetect. CBCDetect counts CBCs in all against all of the aligned sequences.
This is important in detecting species that are discriminated by their sexual incompatibility. The count (distance) matrix obtained by CBCDetect is used as input for CBCTree that reconstructs a phylogram by using the algorithm of BIONJ. In this note we describe the features of the toolbox as well as application examples. The toolbox provides a graphical user interface.
It is written in C++ and freely available at:http://cbcanalyzer.bioapps.biozentrum.uni-wuerzburg.de.
PMID: 15996120 [PubMed - indexed for MEDLINE]

YANAsquare
http://www.biomedcentral.com/1471-2105/8/313
BMC Bioinformatics. 2007 Aug 28;8:313. Integrated network reconstruction, visualization and analysis using YANAsquare. Schwarz R, Liang C, Kaleta C, Kühnel M, Hoffmann E, Kuznetsov S, Hecker M, Griffiths G, Schuster S, Dandekar T. Department of Bioinformatics, Biocenter Am Hubland, D-97074 University of Würzburg, Germany. BACKGROUND: Modeling of metabolic networks includes tasks such as network assembly, network overview, calculation of metabolic fluxes and testing the robustness of the network. RESULTS: YANAsquare provides a software framework for rapid network assembly (flexible pathway browser with local or remote operation mode), network overview (visualization routine and YANAsquare editor) and network performance analysis (calculation of flux modes as well as target and robustness tests). YANAsquare comes as an easy-to-setup program package in Java. It is fully compatible and integrates the programs YANA (translation of gene expression values into flux distributions, metabolite network dissection) and Metatool (elementary mode calculation). As application examples we set-up and model the phospholipid network in the phagosome and genome-scale metabolic maps of S.aureus, S.epidermidis and S.saprophyticus as well as test their robustness against enzyme impairment. CONCLUSION: YANAsquare is an application software for rapid setup, visualization and analysis of small, larger and genome-scale metabolic networks. PMCID: PMC2020486
PMID: 17725829 [PubMed - indexed for MEDLINE]
YANA
Original version YANA, which delivers the possibility of establishing network and FBA. see
http://www.biomedcentral.com/1471-2105/6/135
BMC Bioinformatics. 2005 Jun 1;6:135. YANA - a software tool for analyzing flux modes, gene-expression and enzyme activities. http://www.ncbi.nlm.nih.gov/pubmed/15929789 Schwarz R, Musch P, von Kamp A, Engels B, Schirmer H, Schuster S, Dandekar T. Dept of Bioinformatics, Biocenter, University of Würzburg, Germany.
BACKGROUND: A number of algorithms for steady state analysis of metabolic networks have been developed over the years. Of these, Elementary Mode Analysis (EMA) has proven especially useful. Despite its low user-friendliness, METATOOL as a reliable high-performance implementation of the algorithm has been the instrument of choice up to now. As reported here, the analysis of metabolic networks has been improved by an editor and analyzer of metabolic flux modes. Analysis routines for expression levels and the most central, well connected metabolites and their metabolic connections are of particular interest.
RESULTS: YANA features a platform-independent, dedicated toolbox for metabolic networks with a graphical user interface to calculate (integrating METATOOL), edit (including support for the SBML format), visualize, centralize, and compare elementary flux modes. Further, YANA calculates expected flux distributions for a given Elementary Mode (EM) activity pattern and vice versa. Moreover, a dissection algorithm, a centralization algorithm, and an average diameter routine can be used to simplify and analyze complex networks. Proteomics or gene expression data give a rough indication of some individual enzyme activities, whereas the complete flux distribution in the network is often not known. As such data are noisy, YANA features a fast evolutionary algorithm (EA) for the prediction of EM activities with minimum error, including alerts for inconsistent experimental data. We offer the possibility to include further known constraints (e.g. growth constraints) in the EA calculation process. The redox metabolism around glutathione reductase serves as an illustration example. All software and documentation are available for download at www.biozentrum.uni-wuerzburg.de/bioinfo/computing/. CONCLUSION: A graphical toolbox and an editor for METATOOL as well as a series of additional routines for metabolic network analyses constitute a new user-friendly software for such efforts.
PMCID: PMC1175843
PMID: 15929789 [PubMed - indexed for MEDLINE]
![]()
PlateletWeb provides a novel systems biology workbench for the analysis of platelet signaling in the functional context of integrated networks. The database was established combining data from recent platelet proteome and transcriptome (SAGE) studies with information on protein-protein interactions and kinase-substrate relationships extracted from bioinformatical databases as well as published literature. The mass spectrometry-based platelet phosphoproteome was combined with site-specific phosphorylation/ dephosphorylation information from the Human Protein Database (HPRD), enhanced with data from PhosphoSite and complemented by bioinformatical sequence analysis for site-specific kinase predictions. The integration of annotations on kinases, protein domains, transmembrane regions, Gene Ontology, disease associations and drug targets provides ample functional tools for platelet signaling analysis. The use of graphical visualisation for specific subnetworks allows the investigation of major signaling modules involved in platelet activation and inhibition. Through integration of various information sources and high curation standards, PlateletWeb offers the systems biological background for investigation of signal transduction in human platelets. If you use information from this resource, please cite the following publication:
![]()
A Java Applet for Exploring the New Higher Level Classification of Eukaryotes with Emphasis on the Taxonomy of Protists

http://www.biomedcentral.com/1471-2105/7/498
BMC Bioinformatics. 2006 Nov 13;7:498.
4SALE--a tool for synchronous RNA sequence and secondary structure alignment and editing.
Seibel PN, Müller T, Dandekar T, Schultz J, Wolf M.
Department of Bioinformatics, Biocenter, University of Würzburg, Am Hubland,
Würzburg, Germany.
BACKGROUND: In sequence analysis the multiple alignment builds the fundament of all proceeding analyses. Errors in an alignment could strongly influence all succeeding analyses and therefore could lead to wrong predictions. Hand-crafted and hand-improved alignments are necessary and meanwhile good common practice. For RNA sequences often the primary sequence as well as a secondary structure consensus is well known, e.g., the cloverleaf structure of the t-RNA. Recently, some alignment editors are proposed that are able to include and model both kinds of information. However, with the advent of a large amount of reliable RNA sequences together with their solved secondary structures (available from e.g. the ITS2 Database), we are faced with the problem to handle sequences and their associated secondary structures synchronously.
RESULTS: 4SALE fills this gap. The application allows a fast sequence and synchronous secondary structure alignment for large data sets and for the first time synchronous manual editing of aligned sequences and their secondary structures. This study describes an algorithm for the synchronous alignment of sequences and their associated secondary structures as well as the main features of 4SALE used for further analyses and editing. 4SALE builds an optimal and unique starting point for every RNA sequence and structure analysis.
CONCLUSION: 4SALE, which provides an user-friendly and intuitive interface, is a comprehensive toolbox for RNA analysis based on sequence and secondary structure information. The program connects sequence and structure databases like the ITS2 Database to phylogeny programs as for example the CBCAnalyzer. 4SALE is written in JAVA and therefore platform independent.
The software is freely available and distributed from the website at http://4sale.bioapps.biozentrum.uni-wuerzburg.de.
PMCID: PMC1637121
PMID: 17101042 [PubMed - indexed for MEDLINE]
A tool for Synchronous RNA Sequence and Secondary Structure Alignment and Editing
![]()
ITS2 Database
Metatool is a C program developed from 1998 to 2000 by Thomas Pfeiffer in cooperation with Juan Carlos Nuno (Madrid) Stefan Schuster and Ferdinand Moldenhauer (Berlin) . It serves to derive conclusions about the pathway structure of metabolic networks from the stoichiometric reaction equations and information about reversibility and irreversibility of enzymes. Algorithm described here.
![]() Friedrich-Schiller-Universität Jena
Friedrich-Schiller-Universität Jena

Isotopo is a user-friendly platform for the mass isotopomer distribution analysis (MIDA), a technique that enables the determination of metabolic fluxes on the basis of labelling experiments using 13C-enriched precursors. It is developed with facile data management and robustness to quantify the populations of isotopomers in mixtures of 13C-labelled amino acids. It is capable of processing experimental data (GC-MS), estimating mass values and predicting natural abundance values, relative abundance values and fractional molar abundance values.
Isotopo provides the new standardization of experimental data with a database and a file based record keeping system for the efficient data manipulation and management. It also offers a special purpose data classifier (IDC) based on supervised machine learning principles, towards the automatic isotopomer data extraction, classification and standardization (from excel data sheets). It is designed following software engineering principles, implemented in Microsoft Visual Studio Dot Net (C#) following human computer interaction design patterns and well tested in house.

Least Square Mass Isotopomers Distribution Analyzer (LS-MIDA) is an application developed to estimate mass isotopomers distribution from Spectral data by analyzing each peak of given mass and each mass atom fragment. It is capable of analyzing (isotopic) labeled (Carbon) metabolite based experimental raw data (different amino acids). It estimates mass values (minimum and maximum), predicts theoretical values for pure compounds, draws linear relationships between masses within the range of a compound and performs linear regression analysis to predict relative intensity values with respect to the each mass to charge ratio. To give better understanding of obtained results, LS-MIDA visualizes obtained results by drawing a Spectrometer.

ADAM
Intelligent integrated data management to model and monitor pathophysiological cascades in thrombosis and hemostasis. This research is to design and support the medicine community with the proposition and implementation of an innovative initiative, addressing major challenges of providing optimal management of a certain diagnosis, working rapidly under emergency conditions, protecting personal data, coupling individual patient data with general repositories, allowing therapy monitoring, analyzing individual variations with the and incorporation golden standard therapy guidelines with the proposition of high quality integrated Product Data Management solution, expecting a broad acceptance in European/International industry for better data analysis, efficient management and global usage.
Molecular sequencing techniques help to understand microbial biodiversity with regard to species richness, assembly structure and function. In this context, available methods are barcoding, metabarcoding, genomics and metagenomics. The first two are restricted to taxonomic assignments, whilst genomics only refers to functional capabilities of a single organism. Metagenomics by contrast yields information about organismal and functional diversity of a community. However currently it is very demanding regarding labour and costs and thus not applicable to most laboratories. Here, we show in a proof-of-concept that computational approaches are able to retain functional information about microbial communities assessed through 16S rDNA (meta)barcoding by referring to reference genomes. We developed an automatic pipeline to show that such integration may infer preliminary or supplementary genomic content of a community. We applied it to two biological datasets and delineated significantly overrepresented protein families between communities.
Reference:
Keller A, Horn H, Förster F, Schultz J. Computational integration of genomic traits into 16S rDNA microbiota sequencing studies. Gene. 2014 Jul 30. pii: S0378-1119(14)00890-7. doi: 10.1016/j.gene.2014.07.066. PubMed PMID: 25084126.