NeuralActivityCubic
Neural Activity Cubic
NA³ - Computation of local and 'signal-close-to-noise' calcium activity
Calcium imaging has become a standard tool to investigate local, spontaneous, or cell-autonomous calcium signals in neurons. Some of these calcium signals are fast and ‘small’, thus making it difficult to identify real signaling events due to an unavoidable signal noise. Therefore, it is difficult to assess the spatiotemporal activity footprint of individual neurons or a neuronal network. We developed this open source tool to automatically extract, count, and localize calcium signals from the whole x,y-t image series. The tool is useful for an unbiased comparison of activity states of neurons, helps to assess local calcium transients, and even visualizes local homeostatic calcium activity. The calcium event computation is based on a continuous wavelet transform-guided peak detection to identify calcium signal candidates. The highly sensitive calcium event definition is based on identification of peaks in 1D data through analysis of a 2D wavelet transform surface. The tool is powerful enough to visualize signal-close-to-noise calcium activity, but can also be applied on other imaging data.
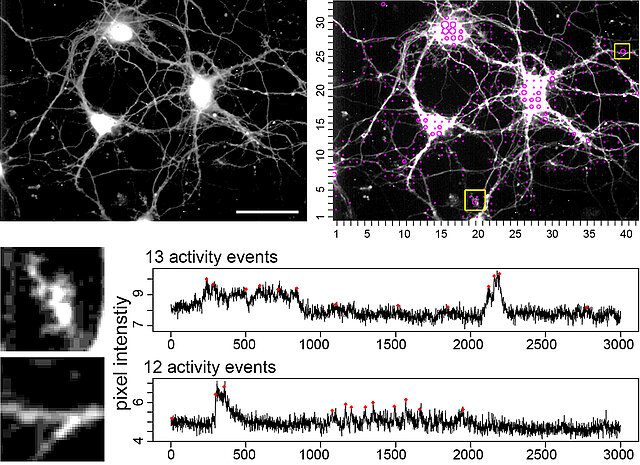
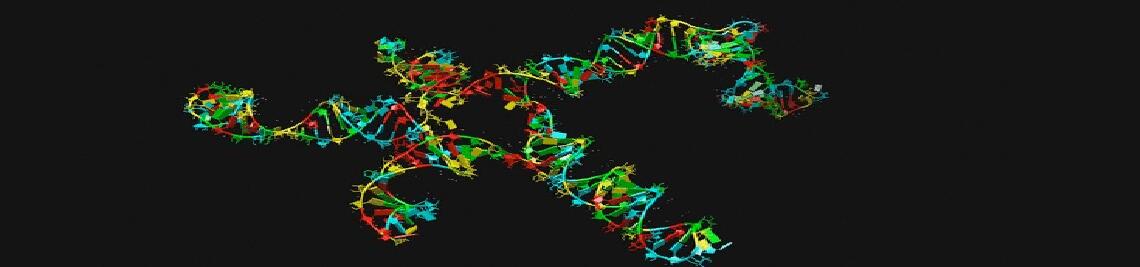
Figure. This open source tool automatically extracts, counts, and localizes calcium signals in the whole x,y-t image series.
Concept
This bioinformatic tool facilitates the unbiased assessment of calcium signals from x,y-t imaging raw data. The tool can be adapted for use with diverse imaging data sets in which changes in bit-values show a transient-like character.
This tool shifts the focus from calcium spike analysis of cell bodies to local ‘signal-close-to-noise’ analysis in any area of a neuron.
The idea is to use an unbiased x,y-grid, to include all pixels in an imaging video and to offer an activity distribution map. The tool avoids a preferential look at one activity mode of a neuron, e.g. the spiking behavior of neuronal somata, but instead tries to find every activity by detecting signals-close-to-noise, however small.
The tool is highly sensitive for local, specific activity and challenges the "all is just noise" hypothesis. Our tool accepts that a signal trace is never smooth. Pre-processing of raw data is not needed and all information from a grid window is included.
Description of operation
One cannot easily decide whether computed calcium signals close to the noise are ‘real’ signals, or wrongly identified signals. Our tool accepts this problem and decides that it is, for the unbiased identification of local and spontaneous signals, better to label event candidates, than to ignore them.
Therefore we tested multiple strategies and found that a continuous wavelet transform-guided peak detection works best to identify 'signal-close-to noise' signal candidates.
The wavelet transform provides a set of point candidates that could be possibly labeled as calcium activity peaks. However, this labeling depends on a pruning process done to the tree formed by the set of candidates. This pruning process is done following the branches on the activity tree and such branches are formed according to the ridges of the wavelet transform. The pruning process discards such points which are not present in more than one scale (meaning that they are just local maxima) and those points that do not have the minimally required signal to noise ratio level. At the end of the pruning, all the remaining points are tagged as activity peaks.
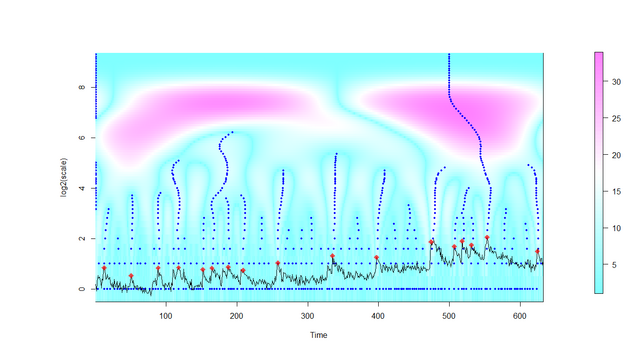
Figure. After extraction of the image signal in a grid window, all local maxima of the intensity signal are identified at several scales (y-axis) and signal candidates are selected and marked (red dots). Details are explained in the publication (Prada et al., PLOS Comp Biol, 2018) and in the user manual.
Output data
1) A dataset (example PDF file showing the activity map and event identification of spontaneous activity in hippocampal neurons) is created and shows loci of activity, individual traces of active loci, and calculates a number of activity events.
2) The tool can also compute the signal variance in a sliding window to visualize activity-dependent signal fluctuations.
Contributors
Juan Prada1, Manju Sasi2, Corinna Martin, Sibylle Jablonka2, Thomas Dandekar1, and Robert Blum2
1 Department of Bioinformatics, University of Würzburg, Würzburg, Germany
2 Institute of Clinical Neurobiology, University Hospital Würzburg, Würzburg, Germany
o Conceptualization: Juan Prada, Thomas Dandekar, Robert Blum.
o Software: Juan Prada, Thomas Dandekar
o Imaging data: Manju Sasi, Corinna Martin, Robert Blum.
o Methodology: Manju Sasi, Sibylle Jablonka, Robert Blum.
o Supervision: Thomas Dandekar, Robert Blum.
o Validation: Juan Prada, Manju Sasi, Corinna Martin, Thomas Dandekar, Robert Blum
Reference
Prada J, Sasi M, Martin C, Jablonka S, Dandekar T, Blum R (2018) An open source tool for automatic spatiotemporal assessment of calcium transients and local 'signal-close-to-noise' activity in calcium imaging data. PLoS computational biology 14:e1006054
DOI: 10.1371/journal.pcbi.1006054
Downloads
Software tools:
Neural Activity Cubic: https://github.com/jpits30/NeuronActivityTool
Neural Activity Cubic with ROI utilities: https://github.com/jpits30/NeuronActivityTool_ROI
User Manual:
Test data:
Test dataset 1: Spiking Neuron
Test dataset 2: Neuron in Tetrodotoxin and CNQX to inhibit neuronal spiking
Raw data:
Data description PDF
Motoneuron at high or low activity state Fig1
Hippocampal neurons, spontaneously active Fig3
Hippocampal neurons. Spiking was acutely blocked Fig4
Hippocampal neurons. Control; neurons show a certain number of local activity events in the periphery. cLTP; neurons are stimulated with a chemical LTP solution Fig5
Camera noise videos. Fig6aFig6b
Hippocampal neurons. Control; spontaneously fast spiking neuron. Spike blockade; spiking behavior was acutely blocked.Fig7aFig7b
Hippocampal neurons. Control; spontaneously spiking neuron. Spike blockade; spiking was acutely blocked, however, growth cone like structures and activity hot spots show calcium activity under spike block conditions. Fig8aFig8b
Signals close to the noise level. Hippocampal neuron. Acute removal of extracellular calcium and acute re-addition of calcium reveals homeostatic resting calcium fluxes. Fig10
Questions, comments, issues
Please contact us at juan.prada_salcedo@uni-wuerzburg.de (concept, software issues, algorithm) or Blum_R@UKW.de (concept, usage, research questions).